OPEN-ACCESS UNIVERSITY TEACHING RESOURCES · POWERED BY EPICOSAI
Clinical Biostatistics Teaching Kit
Use the four-volume series for theory, then explore case-based teaching materials and supported EPICOSAI practice. Each topic shows its available files and editorial review status.
MedicReS Good Biostatistical Practice—ethical, valid, reliable and necessary.
Clinical biostatistics should help us ask better questions, design more meaningful studies and recognise what evidence can—and cannot—support.
Teaching it therefore requires more than explaining statistical tests or demonstrating software.
We developed the Clinical Biostatistics Teaching Kit to connect scientific reasoning with practical teaching. Created by the EPICOSAI team under my scientific and educational editorship, the platform brings together the four-volume Clinical Biostatistics with EPICOSAI series, educator resources and clinical case exercises.
At epicosai.education, our shared purpose is to help educators turn methodological knowledge into learning that students can understand, question and apply.
Four books, one connected approach
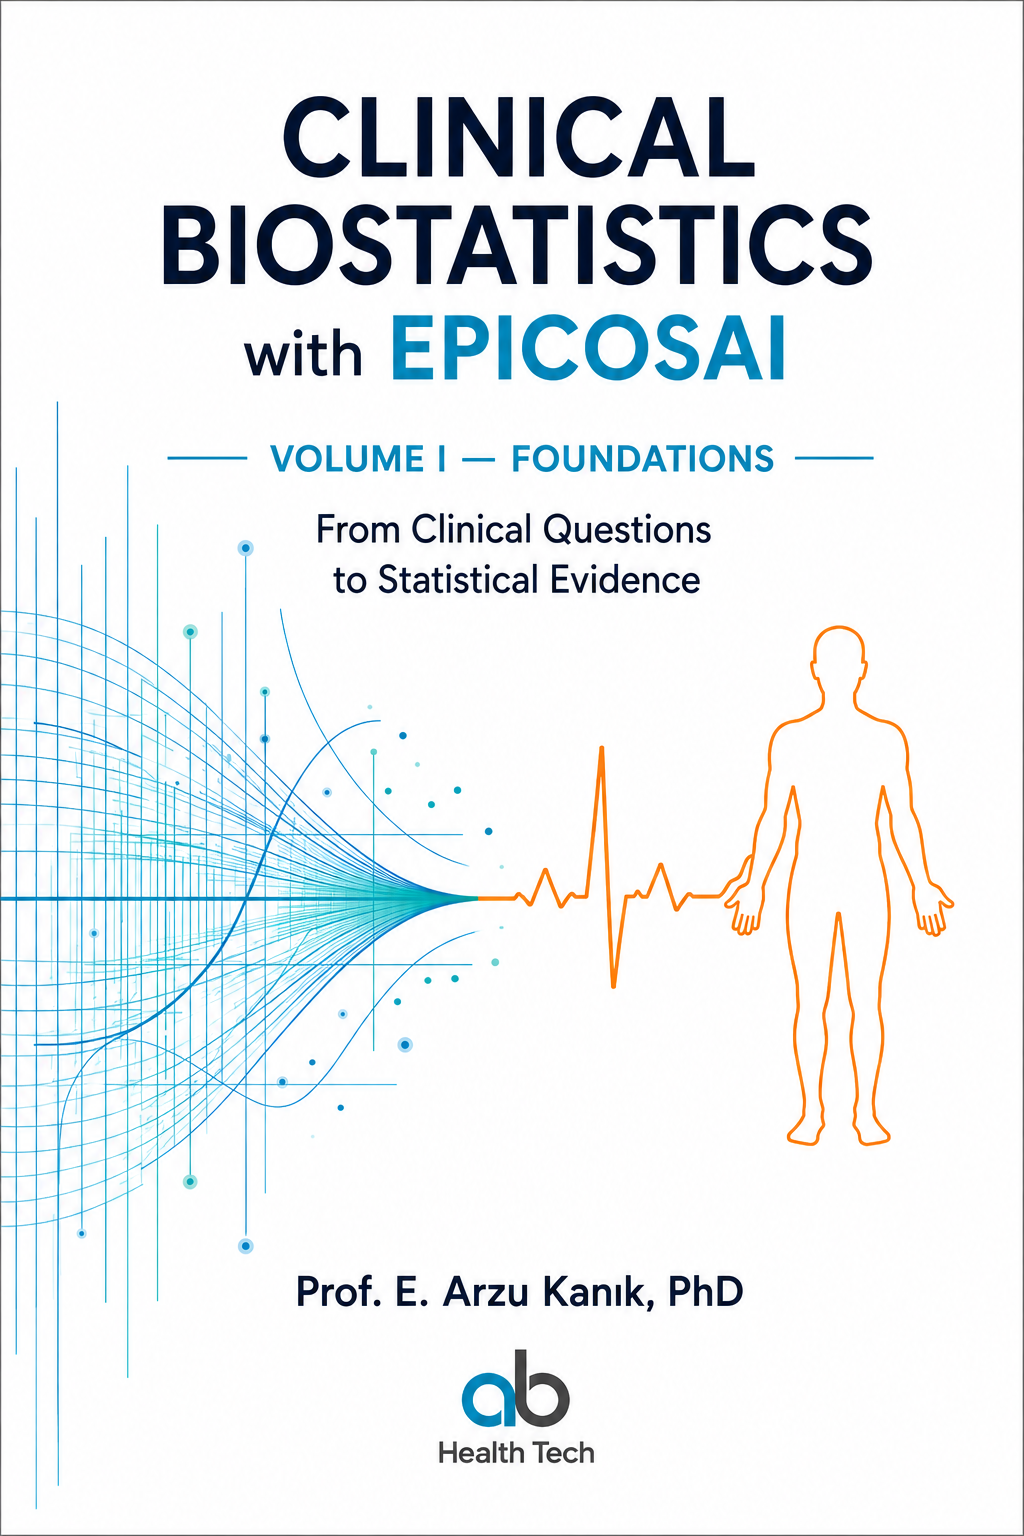
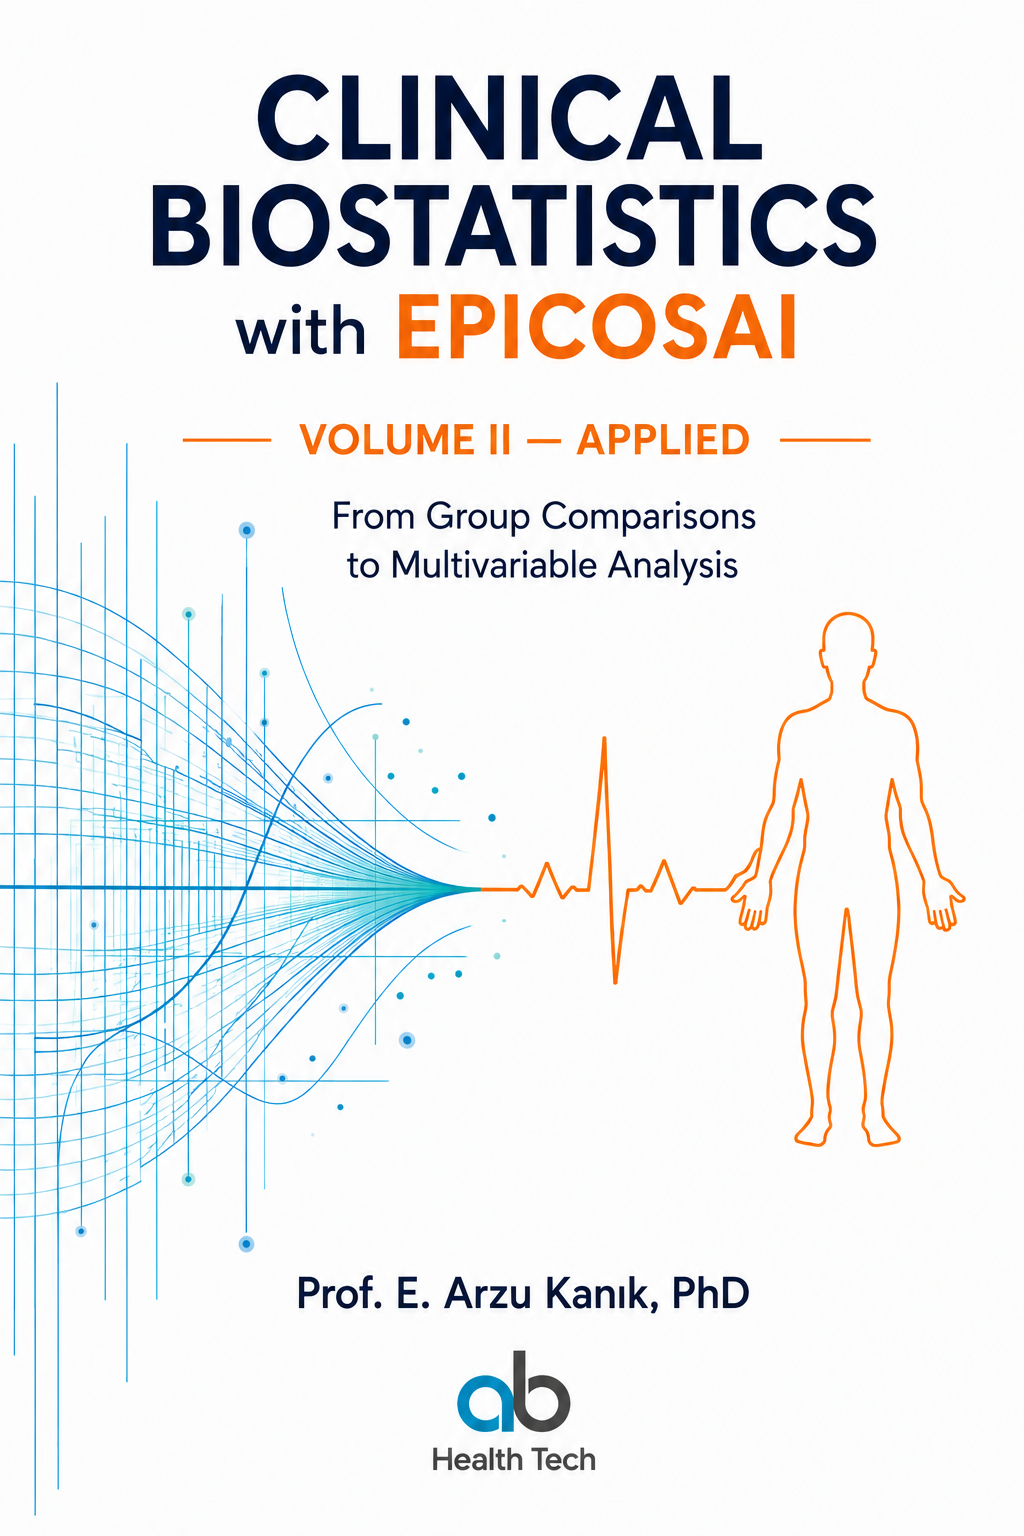
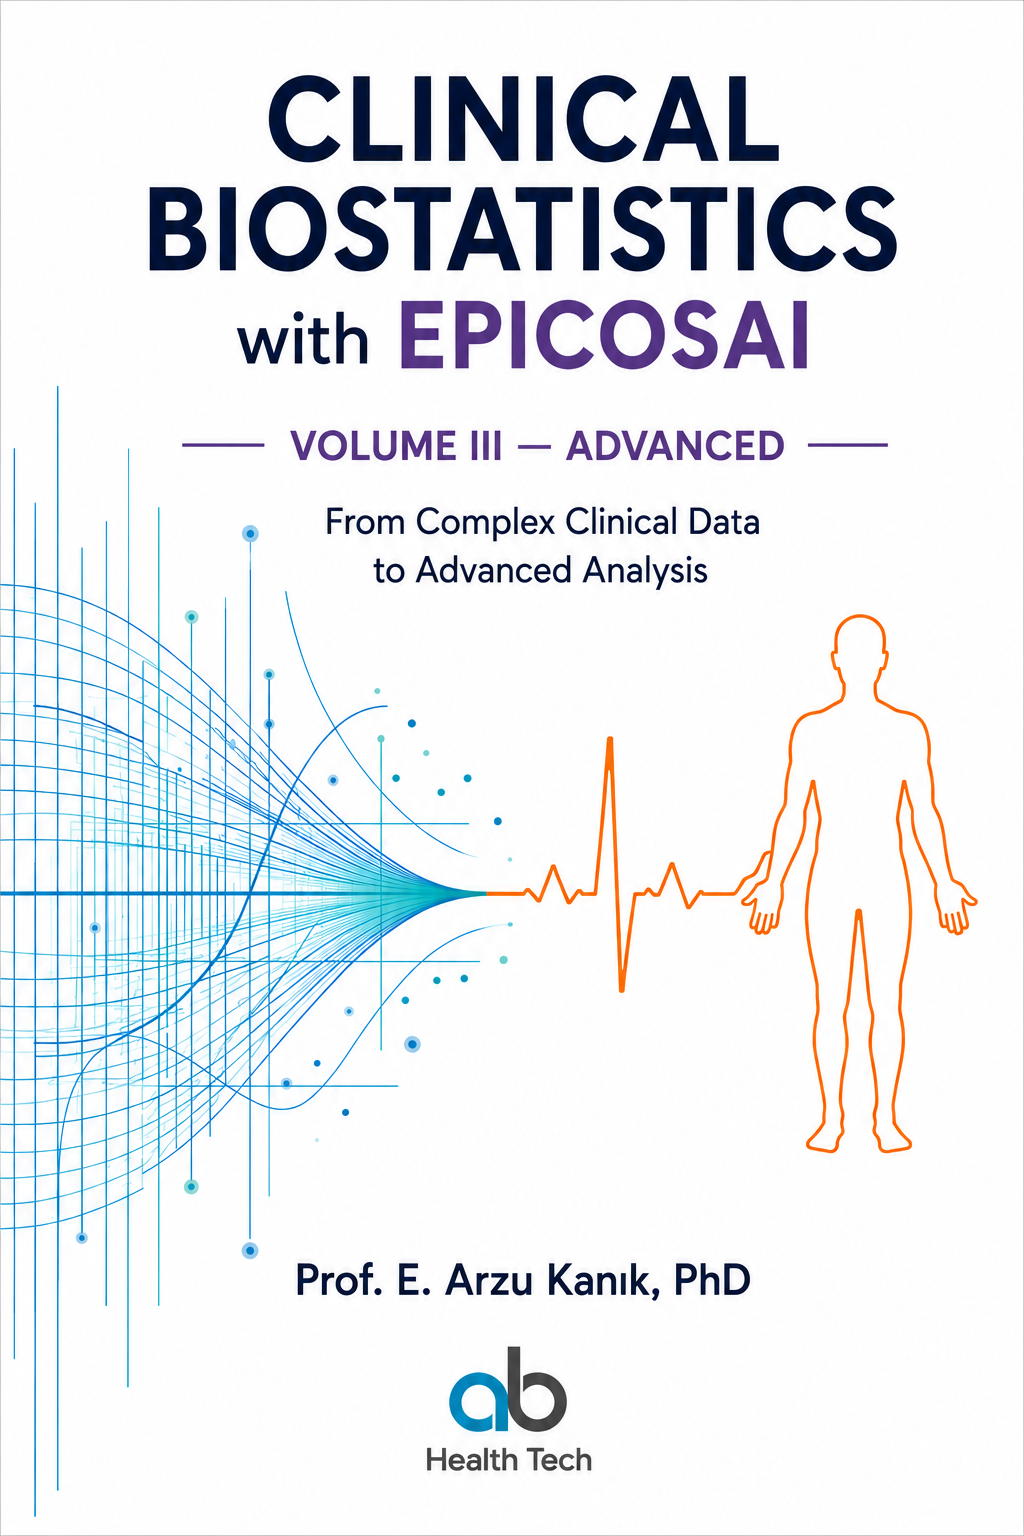
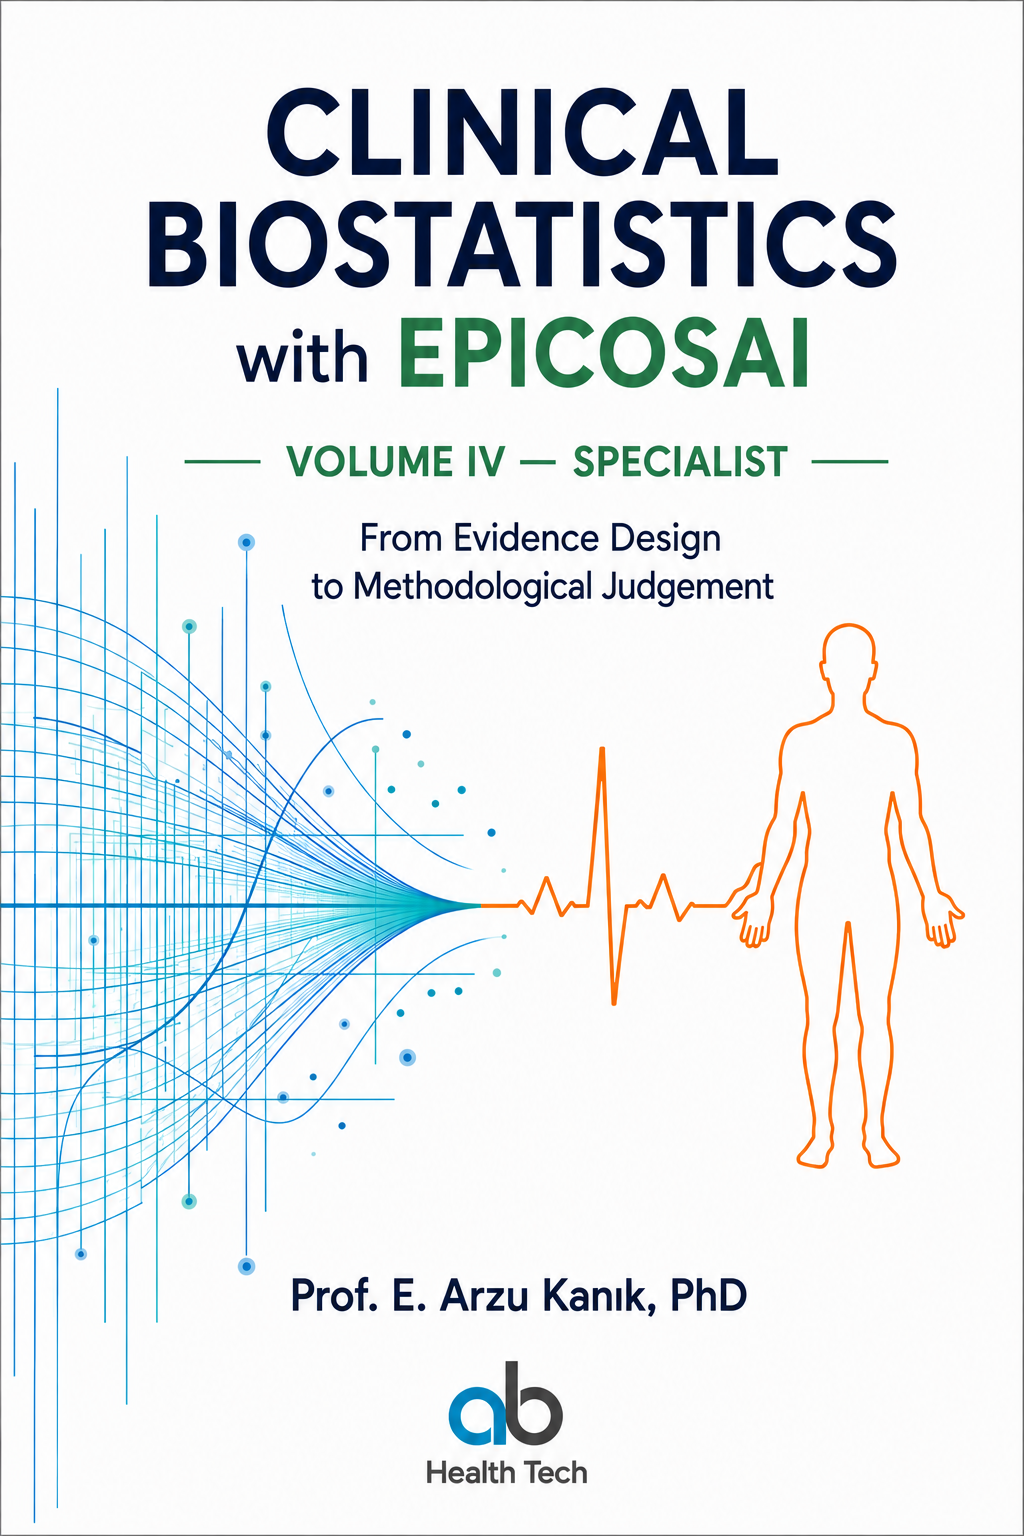
The four volumes—Foundations, Applied, Advanced and Specialist—provide a progressive pathway from understanding clinical data to selecting methods, analysing complex data and exercising methodological judgement.
Across the series, the organising principle is a connected research process:
Frame → Design → Analyse → Interpret → Publish
A calculation belongs within this process. Before choosing a method, we need to understand the clinical question, the population, the outcome and the study design. After obtaining a result, we must examine uncertainty, assumptions, possible bias and clinical meaning.
The website extends this approach into teaching. Related book chapters provide the conceptual foundation; teaching resources help educators develop a lesson; clinical exercises invite learners to make decisions and explain their reasoning.
Resources that support the educator
The platform brings together 15 general educator packs, nine application lessons and 88 medical specialty case packs.
The specialty collection allows an educator to begin with a familiar clinical setting. Each pack provides an introductory fictional case, learning outcomes, fixed teaching inputs, six discussion questions and suggested answers. Separate student exercises and educator guides are available to download.
These are focused teaching activities, not complete specialty curricula. Their purpose is to make a statistical concept concrete while preserving the clinical distinctions that matter.
A shared method does not make two clinical questions interchangeable. Comparing measurements in ophthalmology, interpreting an outcome in cardiology and evaluating a diagnostic classification may require different reasoning—even when parts of the statistical approach overlap.
For that reason, the clinical case, its questions and its associated downloads must remain connected.
What EPICOSAI contributes
The teaching materials and EPICOSAI have complementary roles.
The website provides the teaching context. EPICOSAI provides the relevant practical environment.
Where supported, learners can use sample data within the selected statistical tool. Other activities begin with different inputs: design assumptions, a research protocol, an authorised manuscript or study-level information for evidence synthesis.
Not every lesson requires a dataset. Not every summary exercise can be reproduced by entering its numbers into a raw-data tool. The resources distinguish between calculations that can be completed from the supplied summaries and practical analyses that require individual observations.
This distinction is part of the learning. Software can support analysis and reporting, but it cannot remove the researcher’s responsibility to understand the question, justify the method and interpret the output.
Learning through explanation
The central educational question is not simply, “Did the student obtain the expected number?”
It is also:
Why is this method appropriate?
What assumptions are being made?
What additional information would be needed?
What does the result mean in this clinical setting?
Which conclusion would go beyond the evidence?
Suggested answers support discussion and feedback; they do not replace an educator’s judgement. A correct calculation accompanied by an unjustified clinical conclusion is not sufficient.
Open access to materials, clear boundaries
The teaching resources are openly accessible on the website. EPICOSAI software access is a separate offering, with its own trial and university access arrangements.
For ISCB–GMDS 2026 in Freiburg, we are also offering the four-volume PDF book series as a complimentary congress gift. This is an invitation to explore the approach, use the teaching resources and consider how they might support your own students and colleagues.
The books remain in English. Further language editions of the website and teaching materials are planned.
A resource that will continue to develop
This platform is intended to grow through teaching experience, careful review and constructive feedback. Its value will depend not only on the number of resources available, but on their clarity, scientific accuracy and usefulness in real educational settings.
Our guiding principles are those of MedicReS Good Biostatistical Practice:
Ethical · Valid · Reliable · Necessary
Our aim is not merely to make statistical tools easier to use. It is to help educators teach why a method is needed, when it is appropriate and how its results can responsibly contribute to trustworthy evidence.
Prof. E. Arzu Kanık, PhD Editor, Clinical Biostatistics Teaching Kit Scientific Director, MedicReS
The Clinical Biostatistics with EPICOSAI series follows academic progression from statistical foundations to specialist methodological judgement. Select a volume to explore its curriculum or download the published PDF.
VOLUME I · CONGRESS GIFT · PDF AVAILABLE
Foundations
Understand clinical data and statistical evidence.
ISCB–GMDS 2026 · Congress Gift
A complimentary PDF for congress participants.
Freiburg · 27 September–1 October 2026Volume I · Foundations · 243 pages
VOLUME II · CONGRESS GIFT · PDF AVAILABLE
Applied
Choose and apply statistical methods to clinical questions.
ISCB–GMDS 2026 · Congress Gift
A complimentary PDF for congress participants.
Freiburg · 27 September–1 October 2026Volume II · Applied · 399 pages
VOLUME III · CONGRESS GIFT · PDF AVAILABLE
Advanced
Analyse complex, longitudinal and time-to-event clinical data.
ISCB–GMDS 2026 · Congress Gift
A complimentary PDF for congress participants.
Freiburg · 27 September–1 October 2026Volume III · Advanced · 256 pages
VOLUME IV · CONGRESS GIFT · PDF AVAILABLE
Specialist
Design, evaluate and judge complex clinical evidence.
ISCB–GMDS 2026 · Congress Gift
A complimentary PDF for congress participants.
Freiburg · 27 September–1 October 2026Volume IV · Specialist · 495 pages
Read the relevant book chapter, then choose a clinical exercise. Nine dedicated pathway lessons include student handouts and educator answers. Related general packs are labelled with their actual, different teaching cases.
88 Medicine case packs8 professional fields19 example pathways
Medicine · M026DEDICATED CASE PACK
Cardiology
Discharge follow-up and heart-failure readmission
Risks and crude effect measures
Medicine · M084DEDICATED CASE PACK
Medical Oncology
Time to progression or death in oncology
Kaplan–Meier risk sets
Medicine · M028DEDICATED CASE PACK
Neurology
Seizure-event rates during neurological follow-up
Event rates and person-time
Medicine · M019DEDICATED CASE PACK
Ophthalmology
Agreement in intraocular-pressure measurement
Bland–Altman agreement
Medicine · M010DEDICATED CASE PACK
Paediatrics
School absence after an asthma education programme
Event rates and person-time
Medicine · M016DEDICATED CASE PACK
General Surgery
Post-discharge contact and wound review
Risks and crude effect measures
NursingILLUSTRATIVE CONTEXT
Patient Safety
Pressure-injury prevention across hospital wards
Design
Clustered quality study
Methods
Risk ratios · Multilevel data
Open dedicated lesson P02 · 45–60 minutes
Pressure-injury prevention across wards
Fictional ward-randomised study: 10 wards per arm, about 30 patients per ward; intervention has 24 injuries among 300 patients and control 36 among 300. Planning ICC is 0.03. No ward-level outcomes are supplied.
Learning outcomes
Identify the unit of randomisation
Calculate a crude risk ratio
Explain the impact of clustering
Teaching notes
Patients share ward practices. The ward is the randomisation unit; treating 600 patients as independent usually understates uncertainty. A design effect is a planning approximation, not a replacement for a cluster-aware analysis. Small numbers of clusters require care.
Practice pathway
Use manual arithmetic for crude risks and planning design effect. A fitted cluster analysis needs ward-level or patient-level identified data. Read the book for clustered models and check supported tools before practice; no built-in ward dataset is promised.
Discussion questions
1. What is the crude risk ratio?
(24/300)/(36/300) = 0.667; crude risks are 8% and 12%, a difference of -4 percentage points.
2. Calculate the planning design effect.
1 + (30-1) × 0.03 = 1.87, assuming equal cluster size and that ICC is appropriate.
3. Can an ordinary independent-patient interval establish benefit?
No. It ignores the randomisation structure; the supplied totals cannot recover between-ward variation.
4. What must the report include?
Wards and patients per arm, cluster sizes, intervention allocation, missingness, cluster-aware effect and interval, and the limits of generalisation.
One point per answer with correct unit, arithmetic or qualification; four points. Use 10 minutes for design, 15 for calculations, 15 for critique and 10 for a report.
Fictional teaching example; not clinical advice or a validated examination. Related reading: Volume III · Chapter 6. This lesson is a companion exercise, not a reproduction of the book chapter.
Related method, different teaching case: Repeated pain and mobility measures in rehabilitation.
PharmacyILLUSTRATIVE CONTEXT
Medication Safety
Adverse drug reactions and polypharmacy
Design
Pharmacovigilance cohort
Methods
Incidence · Signal assessment
Open dedicated lesson P03 · 45–60 minutes
Polypharmacy and adverse drug reactions
Fictional six-month cohort with complete follow-up: 30 of 150 people taking at least five drugs and 15 of 200 taking fewer drugs experience at least one recorded adverse reaction. Exposure is not randomised.
Learning outcomes
Calculate cumulative risks and a risk ratio
Separate a safety signal from causation
Specify confounding and ascertainment concerns
Teaching notes
Counts concern people with any reaction, not total reaction events. Medication burden may reflect illness severity. Differential monitoring can influence detected reactions. An association is a signal to investigate, not a reason for an individual treatment change.
Practice pathway
Enter the 2×2 aggregate counts in a supported risk-measure calculator, recording outcome and exposure orientation. Compare the result with hand arithmetic. A patient-level adjustment cannot be reconstructed from this table.
Discussion questions
1. Calculate the risks and risk ratio.
20% versus 7.5%; RR = 2.667.
2. Calculate the risk difference.
0.20 - 0.075 = 0.125, or 12.5 percentage points over six months.
3. Name two explanations other than a causal drug-count effect.
Confounding by illness severity or age, and greater reaction detection in intensively monitored patients. Other justified explanations are acceptable.
4. What evidence is missing for an adjusted analysis?
Patient-level timing, baseline health, drug identities/doses, relevant covariates and a pre-specified causal question; the table alone cannot establish causation.
One point for each correct answer with time horizon and causal qualification; four points. Frame for 10 minutes, calculate for 15, discuss bias for 15 and report for 10.
Fictional teaching example; not clinical advice or a validated examination. Related reading: Volume II · Chapter 16. This lesson is a companion exercise, not a reproduction of the book chapter.
Fictional cross-sectional study of 120 adults: a five-item adherence scale has illustrative Cronbach alpha 0.88; 72 adults meet a pre-specified adherence threshold. The adjusted odds ratio for adherence per additional year of age is 1.04. Item-level data and intervals are not supplied.
Learning outcomes
Distinguish reliability from validity
Interpret prevalence and an odds ratio
Identify limits of cross-sectional evidence
Teaching notes
Internal consistency does not establish a single dimension or clinical validity. Dichotomising a score loses information and requires a justified threshold. A cross-sectional association does not show which factor preceded another.
Practice pathway
Interpret the supplied summaries as a discussion exercise. Reliability calculations require item responses; fitting logistic regression requires individual data. Do not claim the illustrative alpha or odds ratio was reproduced in EPICOSAI.
Discussion questions
1. What proportion meets the threshold?
72/120 = 60%, subject to the sampling and measurement limitations.
2. Does alpha 0.88 prove validity?
No. It describes a form of internal consistency under assumptions, not validity or unidimensionality.
3. Interpret the odds ratio.
Each extra year of age is associated with 4% higher odds of meeting the adherence threshold, conditional on the model. This is not a 4-percentage-point probability increase.
4. What would strengthen interpretation?
Inspect item structure, missingness, threshold justification, measurement validity, model form and effect intervals; use longitudinal evidence for temporal questions.
One point per qualified answer; four points. Spend 10 minutes on measurement, 15 on interpretation, 15 on critique and 10 on reporting.
Fictional teaching example; not clinical advice or a validated examination. Related reading: Volume II · Chapter 26. This lesson is a companion exercise, not a reproduction of the book chapter.
Related method, different teaching case: Three postoperative analgesia strategies.
DentistryILLUSTRATIVE CONTEXT
Implantology
Dental implant survival and failure predictors
Design
Retrospective cohort
Methods
Survival analysis · Cox regression
Related method, different teaching case: Oncology trial of progression-free survival.
Drug DevelopmentILLUSTRATIVE CONTEXT
Phase II
Dose–response and early efficacy of a new therapy
Design
Multi-arm randomised trial
Methods
Dose response · Effect estimation
Open dedicated lesson P05 · 45–60 minutes
Dose response without selecting the lucky arm
Fictional randomised trial with 40 participants per arm and complete outcomes: placebo, low, medium and high doses have mean symptom improvements of 2, 4, 6 and 6 points. Corresponding SDs are 5, 5, 6 and 7. Larger improvement is better. Safety outcomes are not supplied.
Learning outcomes
Describe contrasts and a possible plateau
Recognise multiplicity
Separate exploratory dose selection from confirmation
Teaching notes
The largest observed mean does not identify the optimal dose. Planned contrasts or a pre-specified dose-response model should reflect the scientific question. An omnibus test does not identify which dose works, and efficacy alone cannot determine benefit-risk.
Practice pathway
Calculate mean contrasts manually. Use a supported comparison tool only if its input mode accepts these summaries; record assumptions and method. Do not invent individual observations from the means and SDs.
Discussion questions
1. Calculate active-minus-placebo mean improvements.
Low: 2 points; medium: 4 points; high: 4 points.
2. What pattern is suggested?
Increasing mean improvement to the medium dose followed by an observed plateau; uncertainty prevents concluding that the true effects are equal.
3. Why not run many unadjusted comparisons and report the best?
Selection and multiplicity can exaggerate evidence and the chosen effect. Pre-specify the contrast family and an appropriate error-control strategy.
4. Can the high dose be recommended?
No. Precision, safety, clinical importance and the dose-selection objective are needed; this is an educational exploratory example, not a prescribing recommendation.
One point per answer including uncertainty and safety where relevant; four points. Use 10 minutes framing, 15 contrasts, 15 multiplicity and 10 reporting.
Fictional teaching example; not clinical advice or a validated examination. Related reading: Volume II · Chapter 7. This lesson is a companion exercise, not a reproduction of the book chapter.
Efficacy, safety and estimands in a confirmatory trial
Design
Phase III trial
Methods
ITT · Missing data · Sensitivity
Open dedicated lesson P06 · 60 minutes
Estimands, discontinuation and missing outcomes
Fictional Phase III trial randomises 500 patients per arm to compare a symptom score at week 24. Some stop treatment, start rescue medication or miss the week-24 visit. The question is the effect of assignment to treatment in the eligible population, including consequences of discontinuation and rescue.
Learning outcomes
Specify all five estimand attributes
Separate intercurrent events from missing measurements
Align sensitivity analysis with the target
Teaching notes
An estimand specifies treatment conditions, population, variable, handling of intercurrent events and population-level summary. A treatment-policy strategy concerns events such as stopping treatment, not a magic solution to missing outcomes. ITT wording alone does not fully define an estimand.
Practice pathway
Use the written scenario for a protocol-design exercise. Define the estimand and required follow-up before selecting an estimator. This is not a Reviewer manuscript exercise and no built-in estimand calculator is claimed.
Discussion questions
1. Specify an estimand consistent with the question.
Eligible randomised population; assigned treatment versus comparator; week-24 symptom score; treatment-policy handling of discontinuation/rescue; difference in population mean scores.
2. Is a missed visit itself the same as treatment discontinuation?
No. A missed measurement is missing data; discontinuation is an intercurrent event. They can coexist but require distinct specifications.
3. Does labelling an analysis ITT remove missing-data bias?
No. Continued outcome collection and justified missing-data assumptions and estimators remain necessary.
4. Propose a sensitivity analysis for the same estimand.
Assess plausible departures from the primary missing-outcome assumption, for example a pre-specified delta-adjusted analysis. Changing the estimand answers a different question rather than merely testing sensitivity.
One point per complete answer; four points. Allow 15 minutes each for target definition, event classification, missingness and reporting. Accept coherent alternatives that explicitly change the clinical question.
Fictional teaching example; not clinical advice or a validated examination. Related reading: Volume IV · Chapter 5. This lesson is a companion exercise, not a reproduction of the book chapter.
Non-inferiority margins for a cardiovascular device
Fictional trial compares a device with standard care using 30-day complication risk. Device-minus-control risk difference is +1 percentage point, with illustrative 95% CI -1 to +3 points. A pre-specified, clinically justified non-inferiority margin is +4 points; lower complication risk is better.
Learning outcomes
Orient a non-inferiority hypothesis
Compare an interval with a margin
Distinguish non-inferiority from superiority
Teaching notes
For an adverse outcome and this difference direction, excess risk is unfavourable. Non-inferiority requires ruling out excess risk at or beyond the margin at the chosen inferential level. The margin must not be chosen after seeing results. Protocol quality, adherence and assay sensitivity remain important.
Practice pathway
Use the stated interval for an interpretation exercise; no raw dataset is supplied. Inspect design and margin assumptions before any calculation. Do not treat a non-significant superiority test as a non-inferiority test.
Discussion questions
1. Does the stated interval meet the +4-point margin criterion?
Yes: the upper limit +3 is below +4, conditional on the pre-specified analysis and its assumptions.
2. Does it demonstrate superiority?
No. The interval includes zero; it does not establish lower complication risk.
3. Would a +2-point margin give the same decision?
No: the upper limit +3 exceeds +2. This illustrates why clinical margin justification must precede analysis.
4. What must accompany the statistical conclusion?
Margin rationale, endpoint and follow-up definition, adherence/crossovers, missingness, appropriate analysis populations and sensitivity analyses, plus safety and clinical limitations.
One point per answer with correct direction; four points. Use 10 minutes for orientation, 15 interval comparisons, 15 assumptions and 10 reporting.
Fictional teaching example; not clinical advice or a validated examination. Related reading: Volume IV · Chapter 9. This lesson is a companion exercise, not a reproduction of the book chapter.
Related method, different teaching case: Plasma biomarker for early sepsis.
Diagnostic TestsILLUSTRATIVE CONTEXT
Method Comparison
Agreement between a new test and reference method
Design
Paired method study
Methods
Agreement · Bland–Altman
Open dedicated lesson P08 · 45–60 minutes
Agreement between a new and reference method
Fictional independent paired measurements from 50 people: new-minus-reference differences have mean +2 units and SD 5 units. A pre-specified acceptable individual difference is within -8 to +8 units. Approximate normality and constant difference variance are assumed for this exercise.
Learning outcomes
Calculate approximate limits of agreement
Distinguish agreement from correlation
Compare agreement with clinical tolerance
Teaching notes
Bland–Altman analysis examines paired differences versus paired averages. Mean difference describes bias; limits of agreement describe spread of individual differences, not the confidence interval for mean bias. Their estimates also have sampling uncertainty. Repeated measurements need an appropriate extension.
Practice pathway
Calculate approximate limits from the summaries. To produce the actual Bland–Altman plot in EPICOSAI, import authorised paired measurements or use a supported sample and label it as a different dataset. No plot can be reconstructed uniquely from these summaries.
Discussion questions
1. Calculate approximate 95% limits of agreement.
2 ± 1.96 × 5 = -7.8 to +11.8 units.
2. Are these a 95% confidence interval for the mean difference?
No. They estimate the range containing about 95% of individual differences under the stated assumptions; uncertainty intervals for the limits are separate.
3. Is interchangeability supported by the stated tolerance?
Not by these point estimates: the upper limit +11.8 exceeds +8. Clinical criteria, interval uncertainty and assumptions must also be assessed.
4. What should the plot be checked for?
Proportional bias, changing scatter, outliers and dependence; strong correlation alone does not establish agreement.
One point per answer with correct interpretation; four points. Spend 10 minutes on pairing, 15 calculating, 15 checking tolerance and 10 reporting.
Fictional teaching example; not clinical advice or a validated examination. Related reading: Volume II · Chapter 32. This lesson is a companion exercise, not a reproduction of the book chapter.
Fictional herd-randomised field study: 12 herds per arm and 20 cows per herd. Cure occurs in 180/240 treated and 156/240 control cows. Planning ICC is 0.05. Individual herd outcomes and baseline severity are not supplied.
Learning outcomes
Respect herd-level randomisation
Calculate crude effects and a design effect
Separate descriptive estimates from valid inference
Teaching notes
Cows share husbandry and pathogen exposure. Herds, not individual cows, were randomised. A mixed model and a marginal model can target different effect summaries; neither can be fitted using only arm totals.
Practice pathway
Use hand calculations for the supplied summaries, then specify the herd-linked data needed for a cluster-aware model. Do not promise a built-in mixed-model implementation or substitute an independent-cow test.
Discussion questions
1. Calculate the crude cure risks and ratio.
75% versus 65%; RR = 0.75/0.65 = 1.154, approximately.
2. Calculate the planning design effect.
1 + (20-1) × 0.05 = 1.95 under equal cluster size and the stated ICC.
3. Why are arm totals insufficient for a valid cluster-aware interval?
They omit variation and dependence between and within herds; identical totals can arise from very different herd patterns.
4. What should a future dataset contain?
Herd ID, cow ID, assigned arm, baseline severity, outcome definition/timing, missingness and relevant design information. Report both herd and cow counts.
One point per qualified answer; four points. Use 10 minutes design, 15 arithmetic, 15 model discussion and 10 reporting.
Fictional teaching example; not clinical advice or a validated examination. Related reading: Volume III · Chapter 6. This lesson is a companion exercise, not a reproduction of the book chapter.
Related method, different teaching case: Oncology trial of progression-free survival.
A shared statistical method does not make two clinical cases interchangeable. Specialist methods and EPICOSAI features must be verified separately before practical teaching.
THE TEACHING SEQUENCE
From question to evidence.
01FrameTurn uncertainty into a researchable question.
02DesignConnect the question to population, outcomes and design.
03AnalyseChoose methods for the data and estimand.
04InterpretReason with effects, uncertainty and assumptions.
05PublishTurn the analysis into clear, reproducible and responsible evidence.
EDUCATOR LIBRARY · 15 TEACHING TOPICS
Read once. Apply with purpose.
The books provide theory and chapter learning outcomes. Packs provide a distinct teaching case and discussion materials. Each revised English PDF pack contains a case brief, an educator guide with answers and a separate four-question formative quiz.
Revised PDF edition · 1 September 2026
Question-to-answer alignment, numerical teaching examples and case labels have been revised. Use these resources for supervised formative teaching, not as an independently validated examination bank. The revised guides replace overlapping legacy notes, worksheets and keys; original files are preserved. Editable slide decks are not included in this PDF edition.
EDUCATOR PACK 01REVISED PDF · 75–90 min
Medicine & Health Sciences
Clinical Questions, Variables & Data
Teaching case: Frailty and 30-day readmission after heart-failure hospitalisation
Foundation3 available files
EDUCATOR PACK 02REVISED PDF · 75–90 min
Medicine & Health Sciences
Describing Clinical Data
Teaching case: Describing 120 patients entering transitional heart-failure care
Foundation3 available files
EDUCATOR PACK 03REVISED PDF · 90 min
Medicine & Health Sciences
P-values, Confidence Intervals & Uncertainty
Teaching case: Discharge strategies and 12-week systolic blood pressure change
Foundation3 available files
EDUCATOR PACK 04REVISED PDF · 120 min
Residents & MSc
Comparing Clinical Groups
Teaching case: Three postoperative analgesia strategies
Applied3 available files
EDUCATOR PACK 05REVISED PDF · 90 min
Residents & MSc
Categorical Outcomes & Effect Measures
Teaching case: Discharge bundle and 30-day pneumonia risk
Applied3 available files
EDUCATOR PACK 06REVISED PDF · 180 min
Residents & MSc
Linear & Logistic Regression
Teaching case: Six-month lung function and severe COPD exacerbations
Applied3 available files
EDUCATOR PACK 07REVISED PDF · 120 min
Residents & MSc
Diagnostic Accuracy & ROC Analysis
Teaching case: Plasma biomarker for early sepsis
Applied3 available files
EDUCATOR PACK 08REVISED PDF · 180 min
MSc & PhD
Survival Analysis
Teaching case: Oncology trial of progression-free survival
Advanced3 available files
EDUCATOR PACK 09REVISED PDF · 180 min
MSc & PhD
Repeated Measures, GEE & Mixed Models
Teaching case: Repeated pain and mobility measures in rehabilitation
Advanced3 available files
EDUCATOR PACK 10REVISED PDF · 120 min
MSc & PhD
Sample Size & Power
Teaching case: Planning a two-arm rehabilitation trial
Advanced3 available files
EDUCATOR PACK 11REVISED PDF · 180 min
MSc & PhD
Clinical Prediction & Validation
Teaching case: Predicting 30-day readmission after heart-failure discharge
Advanced3 available files
EDUCATOR PACK 12REVISED PDF · 180 min
Biostatistics & Epidemiology
Causal Reasoning & Confounding
Teaching case: Biologic therapy and one-year remission in rheumatoid arthritis
Specialist3 available files
EDUCATOR PACK 13REVISED PDF · 120 min
Biostatistics & Epidemiology
Critical Appraisal & Statistical Review
Teaching case: Statistical review of a clinical manuscript
Specialist3 available files
EDUCATOR PACK 14REVISED PDF · 180 min
Biostatistics & Epidemiology
Systematic Review & Meta-analysis
Teaching case: Six trials of a medication-safety intervention
Specialist3 available files
EDUCATOR PACK 15REVISED PDF · 120 min
Biostatistics & Epidemiology
AI, Synthetic Data & Responsible Practice
Teaching case: Synthetic cardiometabolic data for supervised teaching
Specialist3 available files
THE MEDICRES STANDARD
Good Biostatistical Practice, our editorial standard.
01
Scientific provenance
Scientific provenance and editorial responsibility are made explicit; resources remain subject to review.
02
Full-lifecycle quality
Question, design, data, analysis, interpretation and reporting are taught as one connected process.
03
Competency over attendance
Students demonstrate reasoning through clinical cases, applied tasks and assessment.
04
Responsible technology
EPICOSAI supports learning while the educator remains responsible for teaching and scientific judgement.
A CLEAR ROLE FOR EACH RESOURCE
The book explains. The case applies.
Read theory and chapter outcomes in the books. Use the case brief with students, the revised guide for teaching and answer reasoning, and the separate quiz for a formative check. Application instructions are integrated into the guide rather than duplicated across downloads.
Free access does not by itself grant an open adaptation or redistribution licence. Contact the rights holder for reuse beyond applicable permissions.
01Revised educator guide & answer keyPDF↓
02Clinical case briefPDF↓
03Student formative quizPDF↓
EPICOSAI ANNUAL TEACHING ACCESS
One year of teaching. A plan for your students.
The teaching materials stay open. Add full EPICOSAI platform access for your instructors and students with a package tailored to your teaching year.
INSTRUCTOR FULL ACCESS$900 / instructor / year
12 months of full platform access.
STUDENT FULL ACCESSFrom $1 / student / month
Choose 1–12 months. Packages start at 100 students.
PRACTISE WITH THE APPROPRIATE INPUT
The materials are here. The workflow depends on the task.
Use a built-in sample within the selected tool where supported. Power uses planning assumptions; Reviewer requires an authorised PDF manuscript; Meta uses study-level inputs; Synthetic Data profiles an authorised source spreadsheet. A written pack case is not a promise of an identical built-in sample.
Sample Data: practice examples where supported by the selected test
Designer: research questions, study designs and protocols